How to visualize MRI data?#
[1]:
import polpo.preprocessing.dict as ppdict
from polpo.plot.mri import MriPlotter, MriSlicer, SlicesPlotter
from polpo.preprocessing.load.pregnancy.pilot import MriLoader
Loading data#
We’ll create a pipeline that:
downloads data from figshare
finds nii file in folder
loads image as an array
[2]:
SESSION_ID = 1
[3]:
loader = MriLoader(subset=[SESSION_ID], as_image=True)

pipe = loader + ppdict.ExtractUniqueKey()
[4]:
img_fdata = pipe()
Visualization#
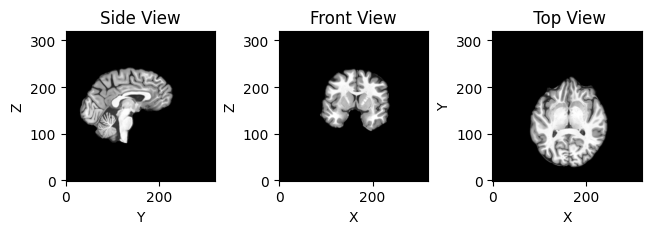
MriSlicer slices the MRI image. SlicesPlotter takes care of plotting slices. By default, it plots side, front and top views.
[5]:
slices_plotter = SlicesPlotter()
slicer = MriSlicer()
[6]:
slices_plotter.plot(slicer.slice(img_fdata, (35, 70, 105)));
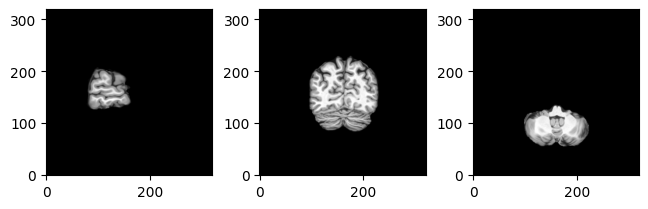
For convenience, there’s also MriPlotter.
[7]:
mri_plotter = MriPlotter()
[8]:
mri_plotter.plot(img_fdata, [val // 2 for val in img_fdata.shape]);