Notebook source code: notebooks/03_methods_estimate_manifold_topology.ipynb
Estimate Neural Topology#
Set Up + Imports#
In [2]:
import setup

setup.main()
%load_ext autoreload
%autoreload 2
%load_ext jupyter_black

import matplotlib.pyplot as plt
import numpy as np
import plotly.graph_objects as go
from gtda.diagrams import PairwiseDistance
from gtda.homology import WeakAlphaPersistence
from gtda.plotting import plot_diagram, plot_heatmap
from plotly.subplots import make_subplots
Working directory:  /home/facosta/neurometry/neurometry
Directory added to path:  /home/facosta/neurometry
Directory added to path:  /home/facosta/neurometry/neurometry
The autoreload extension is already loaded. To reload it, use:
  %reload_ext autoreload
The jupyter_black extension is already loaded. To reload it, use:
  %reload_ext jupyter_black
---------------------------------------------------------------------------
ModuleNotFoundError                       Traceback (most recent call last)
Cell In[2], line 17
     14 from plotly.subplots import make_subplots
     16 # import neurometry.curvature.datasets.experimental as experimental
---> 17 import neurometry.curvature.datasets.gridcells as gridcells
     18 import neurometry.topology.persistent_homology as persistent_homology
     19 import neurometry.curvature.viz as viz

ModuleNotFoundError: No module named 'neurometry.curvature'
In [1]:
import setup

setup.main()
%load_ext autoreload
%autoreload 2
%load_ext jupyter_black

import os

import matplotlib.pyplot as plt
import numpy as np
import torch

os.environ["GEOMSTATS_BACKEND"] = "pytorch"
import geomstats.backend as gs
import neurometry.datasets.synthetic as synthetic

from neurometry.estimators.topology.topology_classifier import TopologyClassifier
Working directory:  /home/facosta/neurometry/neurometry
Directory added to path:  /home/facosta/neurometry
Directory added to path:  /home/facosta/neurometry/neurometry
Classify neural manifold as circle, sphere, torus, or none#
Create example torus point cloud#
In [2]:
num_points = 500
encoding_dim = 10
fano_factor = 0.1


test_task_points = synthetic.hypertorus(2, num_points)
test_noisy_points, _ = synthetic.synthetic_neural_manifold(
    points=test_task_points,
    encoding_dim=encoding_dim,
    nonlinearity="sigmoid",
    scales=5 * gs.random.rand(encoding_dim),
    fano_factor=fano_factor,
)
Fit TopologyClassifier#
In [3]:
num_samples = 100
homology_dimensions = (0, 1, 2, 3)

TC = TopologyClassifier(
    num_samples=num_samples,
    fano_factor=fano_factor,
    homology_dimensions=homology_dimensions,
    reduce_dim=True,
)
TC.fit(test_noisy_points)
Classifier score: 1.0
Out [3]:
TopologyClassifier(fano_factor=0.1, homology_dimensions=(0, 1, 2, 3),
                   num_samples=100, reduce_dim=True)
In a Jupyter environment, please rerun this cell to show the HTML representation or trust the notebook. On GitHub, the HTML representation is unable to render, please try loading this page with nbviewer.org.
TopologyClassifier(fano_factor=0.1, homology_dimensions=(0, 1, 2, 3),
                   num_samples=100, reduce_dim=True)
In [4]:
prediction = TC.predict(test_noisy_points)
Predicted topology: torus
In [6]:
def plot_topo_feature_space(self):
    """Plot the topological feature space of the reference data."""
    import plotly.graph_objects as go

    color_map = {
        0: "black",
        1: "red",
        2: "blue",
        3: "green",
    }
    names = {0: "null", 1: "circle", 2: "sphere", 3: "torus"}

    fig = go.Figure()

    for label in np.unique(self.ref_labels):
        mask = self.ref_labels == label
        fig.add_trace(
            go.Scatter3d(
                x=self.ref_features[mask, 1],
                y=self.ref_features[mask, 2],
                z=self.ref_features[mask, 3],
                mode="markers",
                name=names[label],
                marker=dict(size=3, color=color_map[label]),
            )
        )

    fig.add_trace(
        go.Scatter3d(
            x=self.features[:, 1],
            y=self.features[:, 2],
            z=self.features[:, 3],
            mode="markers",
            name="Input data",
            marker=dict(size=5, color="orange"),
        )
    )
    fig.show()


plot_topo_feature_space(TC)
In [60]:
TC.plot_topo_feature_space()
Persistence homology for synthetic sphere, torus point clouds#
Plot point clouds#
Compute Topological Distance between Persistence Diagrams#
Create torus point clouds with varying levels of noise
In [62]:
num_points = 500
encoding_dim = 10
fano_factors = np.linspace(0.1, 2, 20)

tori = []

scales = 5 * gs.random.rand(encoding_dim)

for fano_factor in fano_factors:
    test_task_points = synthetic.hypertorus(2, num_points)
    test_noisy_points, _ = synthetic.synthetic_neural_manifold(
        points=test_task_points,
        encoding_dim=encoding_dim,
        nonlinearity="sigmoid",
        scales=scales,
        fano_factor=fano_factor,
    )
    tori.append(test_noisy_points)
Compute persistence diagrams for tori and compute pairwise landscape distance
In [74]:
from gtda.diagrams import PairwiseDistance
from neurometry.estimators.topology.topology_classifier import (
    compute_persistence_diagrams,
)

diagrams = compute_persistence_diagrams(tori)
PD = PairwiseDistance(metric="landscape")
distances = PD.fit_transform(diagrams)
In [78]:
distances
Out [78]:
array([[ 0., nan, nan, nan, nan, nan, nan, nan, nan, nan, nan, nan, nan,
        nan, nan, nan, nan, nan, nan, nan],
       [nan,  0., nan, nan, nan, nan, nan, nan, nan, nan, nan, nan, nan,
        nan, nan, nan, nan, nan, nan, nan],
       [nan, nan,  0., nan, nan, nan, nan, nan, nan, nan, nan, nan, nan,
        nan, nan, nan, nan, nan, nan, nan],
       [nan, nan, nan,  0., nan, nan, nan, nan, nan, nan, nan, nan, nan,
        nan, nan, nan, nan, nan, nan, nan],
       [nan, nan, nan, nan,  0., nan, nan, nan, nan, nan, nan, nan, nan,
        nan, nan, nan, nan, nan, nan, nan],
       [nan, nan, nan, nan, nan,  0., nan, nan, nan, nan, nan, nan, nan,
        nan, nan, nan, nan, nan, nan, nan],
       [nan, nan, nan, nan, nan, nan,  0., nan, nan, nan, nan, nan, nan,
        nan, nan, nan, nan, nan, nan, nan],
       [nan, nan, nan, nan, nan, nan, nan,  0., nan, nan, nan, nan, nan,
        nan, nan, nan, nan, nan, nan, nan],
       [nan, nan, nan, nan, nan, nan, nan, nan,  0., nan, nan, nan, nan,
        nan, nan, nan, nan, nan, nan, nan],
       [nan, nan, nan, nan, nan, nan, nan, nan, nan,  0., nan, nan, nan,
        nan, nan, nan, nan, nan, nan, nan],
       [nan, nan, nan, nan, nan, nan, nan, nan, nan, nan,  0., nan, nan,
        nan, nan, nan, nan, nan, nan, nan],
       [nan, nan, nan, nan, nan, nan, nan, nan, nan, nan, nan,  0., nan,
        nan, nan, nan, nan, nan, nan, nan],
       [nan, nan, nan, nan, nan, nan, nan, nan, nan, nan, nan, nan,  0.,
        nan, nan, nan, nan, nan, nan, nan],
       [nan, nan, nan, nan, nan, nan, nan, nan, nan, nan, nan, nan, nan,
         0., nan, nan, nan, nan, nan, nan],
       [nan, nan, nan, nan, nan, nan, nan, nan, nan, nan, nan, nan, nan,
        nan,  0., nan, nan, nan, nan, nan],
       [nan, nan, nan, nan, nan, nan, nan, nan, nan, nan, nan, nan, nan,
        nan, nan,  0., nan, nan, nan, nan],
       [nan, nan, nan, nan, nan, nan, nan, nan, nan, nan, nan, nan, nan,
        nan, nan, nan,  0., nan, nan, nan],
       [nan, nan, nan, nan, nan, nan, nan, nan, nan, nan, nan, nan, nan,
        nan, nan, nan, nan,  0., nan, nan],
       [nan, nan, nan, nan, nan, nan, nan, nan, nan, nan, nan, nan, nan,
        nan, nan, nan, nan, nan,  0., nan],
       [nan, nan, nan, nan, nan, nan, nan, nan, nan, nan, nan, nan, nan,
        nan, nan, nan, nan, nan, nan,  0.]])
In [65]:
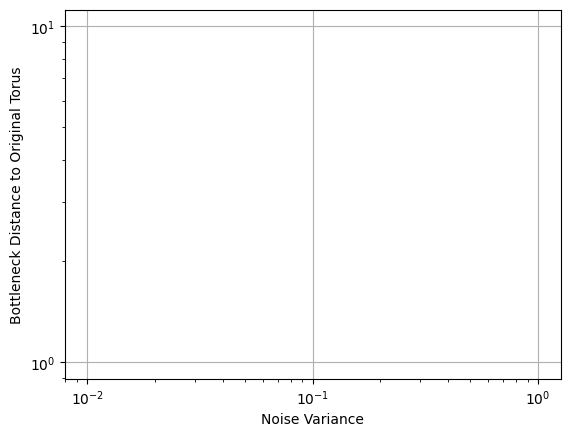
plt.scatter(fano_factors, distances[0, :], label="0D")
plt.xscale("log")
plt.yscale("log")
plt.xlabel("Noise Variance")
plt.ylabel("Bottleneck Distance to Original Torus")

plt.grid()
In [139]:
plot_heatmap(distance, colorscale="blues")
Data type cannot be displayed: application/vnd.plotly.v1+json
In [15]:
# diagram_0 = persistent_homology.compute_persistence_diagrams(
#     torus_0, maxdim=2, n_threads=-1
# )

# diagram_1 = persistent_homology.compute_persistence_diagrams(
#     torus_1, maxdim=2, n_threads=-1
# )
'compute_persistence_diagrams' executed in 46.4076s
'compute_persistence_diagrams' executed in 31.8140s
Persistence homology for place cell data#
Load place cell data#
From Ravikrishnan P Jayakumar, Manu S Madhav, Francesco Savelli, Hugh T Blair, Noah J Cowan, and James J Knierim. Recalibration of path integration in hippocampal place cells. Nature, 566(7745):533–537, 2019.
In [8]:
expt_id = 34
timestep = int(1e6)

dataset, labels = experimental.load_neural_activity(
    expt_id=expt_id, timestep_microsec=timestep
)
dataset = dataset[labels["velocities"] > 5]
labels = labels[labels["velocities"] > 5]
dataset = np.log(dataset.astype(np.float32) + 1)
dataset.shape
INFO: # - Found file at /home/facosta/neurometry/neurometry/data/binned/expt34_times_timestep1000000.txt! Loading...
INFO: # - Found file at /home/facosta/neurometry/neurometry/data/binned/expt34_place_cells_timestep1000000.npy! Loading...
INFO: # - Found file at /home/facosta/neurometry/neurometry/data/binned/expt34_labels_timestep1000000.txt! Loading...
Out [8]:
(934, 40)
Persistence diagrams for place cell data#
In [9]:
place_cell_diagrams = compute_persistence_diagrams(dataset, maxdim=2, n_threads=-1)
plot_persistence_diagrams(place_cell_diagrams)
Function 'compute_persistence_diagrams' executed in 1.6295s
Synthetic Grid cell data#
Generate synthetic grid cell data + compute persistence diagrams#
Orientation variability = 0
In [3]:
grid_scale = 1
arena_dims = np.array([4, 4])
n_cells = 256
grid_orientation_mean = 0
grid_orientation_std = 0

field_width = 0.05
resolution = 50

neural_activity, _ = gridcells.load_grid_cells_synthetic(
    grid_scale,
    arena_dims,
    n_cells,
    grid_orientation_mean,
    grid_orientation_std,
    field_width,
    resolution,
)
print("shape of neural activity matrix: " + str(neural_activity.shape))
shape of neural activity matrix: (2500, 256)
In [4]:
diagrams = compute_persistence_diagrams(neural_activity, maxdim=2, n_threads=-1)
plot_persistence_diagrams(diagrams)
Function 'compute_persistence_diagrams' executed in 4809.5422s
Orientation variability > 0#
In [5]:
grid_scale = 1
arena_dims = np.array([4, 4])
n_cells = 256
grid_orientation_mean = 0
grid_orientation_std = 3

field_width = 0.05
resolution = 50

neural_activity, _ = gridcells.load_grid_cells_synthetic(
    grid_scale,
    arena_dims,
    n_cells,
    grid_orientation_mean,
    grid_orientation_std,
    field_width,
    resolution,
)
print("shape of neural activity matrix: " + str(neural_activity.shape))
shape of neural activity matrix: (2500, 256)
Shuffle Data and plot diagrams#
In [64]:
import os

os.environ["GEOMSTATS_BACKEND"] = "pytorch"
import geomstats.backend as gs

import neurometry.datasets.synthetic as synthetic

task_points = synthetic.hypersphere(1, 1000)
noisy_points, manifold_points = synthetic.synthetic_neural_manifold(
    points=task_points,
    encoding_dim=3,
    nonlinearity="sigmoid",
    scales=gs.array([1, 1, 1]),
    poisson_multiplier=100,
)
noise level: 0.71%
In [65]:
!pip install dreimac
Collecting dreimac
  Downloading dreimac-0.3.1-py3-none-any.whl.metadata (6.2 kB)
Requirement already satisfied: matplotlib>=3.6 in /home/facosta/miniconda3/envs/neurometry/lib/python3.11/site-packages (from dreimac) (3.8.4)
Requirement already satisfied: numba>=0.56 in /home/facosta/miniconda3/envs/neurometry/lib/python3.11/site-packages (from dreimac) (0.59.1)
Requirement already satisfied: numpy>=1.23 in /home/facosta/miniconda3/envs/neurometry/lib/python3.11/site-packages (from dreimac) (1.26.4)
Requirement already satisfied: persim>=0.3 in /home/facosta/miniconda3/envs/neurometry/lib/python3.11/site-packages (from dreimac) (0.3.5)
Requirement already satisfied: ripser>=0.6 in /home/facosta/miniconda3/envs/neurometry/lib/python3.11/site-packages (from dreimac) (0.6.8)
Requirement already satisfied: scipy>=1.10 in /home/facosta/miniconda3/envs/neurometry/lib/python3.11/site-packages (from dreimac) (1.13.0)
Requirement already satisfied: contourpy>=1.0.1 in /home/facosta/miniconda3/envs/neurometry/lib/python3.11/site-packages (from matplotlib>=3.6->dreimac) (1.2.1)
Requirement already satisfied: cycler>=0.10 in /home/facosta/miniconda3/envs/neurometry/lib/python3.11/site-packages (from matplotlib>=3.6->dreimac) (0.12.1)
Requirement already satisfied: fonttools>=4.22.0 in /home/facosta/miniconda3/envs/neurometry/lib/python3.11/site-packages (from matplotlib>=3.6->dreimac) (4.51.0)
Requirement already satisfied: kiwisolver>=1.3.1 in /home/facosta/miniconda3/envs/neurometry/lib/python3.11/site-packages (from matplotlib>=3.6->dreimac) (1.4.5)
Requirement already satisfied: packaging>=20.0 in /home/facosta/miniconda3/envs/neurometry/lib/python3.11/site-packages (from matplotlib>=3.6->dreimac) (24.0)
Requirement already satisfied: pillow>=8 in /home/facosta/miniconda3/envs/neurometry/lib/python3.11/site-packages (from matplotlib>=3.6->dreimac) (10.3.0)
Requirement already satisfied: pyparsing>=2.3.1 in /home/facosta/miniconda3/envs/neurometry/lib/python3.11/site-packages (from matplotlib>=3.6->dreimac) (3.1.2)
Requirement already satisfied: python-dateutil>=2.7 in /home/facosta/miniconda3/envs/neurometry/lib/python3.11/site-packages (from matplotlib>=3.6->dreimac) (2.9.0.post0)
Requirement already satisfied: llvmlite<0.43,>=0.42.0dev0 in /home/facosta/miniconda3/envs/neurometry/lib/python3.11/site-packages (from numba>=0.56->dreimac) (0.42.0)
Requirement already satisfied: scikit-learn in /home/facosta/miniconda3/envs/neurometry/lib/python3.11/site-packages (from persim>=0.3->dreimac) (1.4.2)
Requirement already satisfied: hopcroftkarp in /home/facosta/miniconda3/envs/neurometry/lib/python3.11/site-packages (from persim>=0.3->dreimac) (1.2.5)
Requirement already satisfied: deprecated in /home/facosta/miniconda3/envs/neurometry/lib/python3.11/site-packages (from persim>=0.3->dreimac) (1.2.14)
Requirement already satisfied: joblib in /home/facosta/miniconda3/envs/neurometry/lib/python3.11/site-packages (from persim>=0.3->dreimac) (1.4.0)
Requirement already satisfied: Cython in /home/facosta/miniconda3/envs/neurometry/lib/python3.11/site-packages (from ripser>=0.6->dreimac) (0.29.37)
Requirement already satisfied: six>=1.5 in /home/facosta/miniconda3/envs/neurometry/lib/python3.11/site-packages (from python-dateutil>=2.7->matplotlib>=3.6->dreimac) (1.16.0)
Requirement already satisfied: wrapt<2,>=1.10 in /home/facosta/miniconda3/envs/neurometry/lib/python3.11/site-packages (from deprecated->persim>=0.3->dreimac) (1.16.0)
Requirement already satisfied: threadpoolctl>=2.0.0 in /home/facosta/miniconda3/envs/neurometry/lib/python3.11/site-packages (from scikit-learn->persim>=0.3->dreimac) (3.4.0)
Downloading dreimac-0.3.1-py3-none-any.whl (36 kB)
Installing collected packages: dreimac
Successfully installed dreimac-0.3.1
In [68]:
from dreimac import CircularCoords
from persim import plot_diagrams
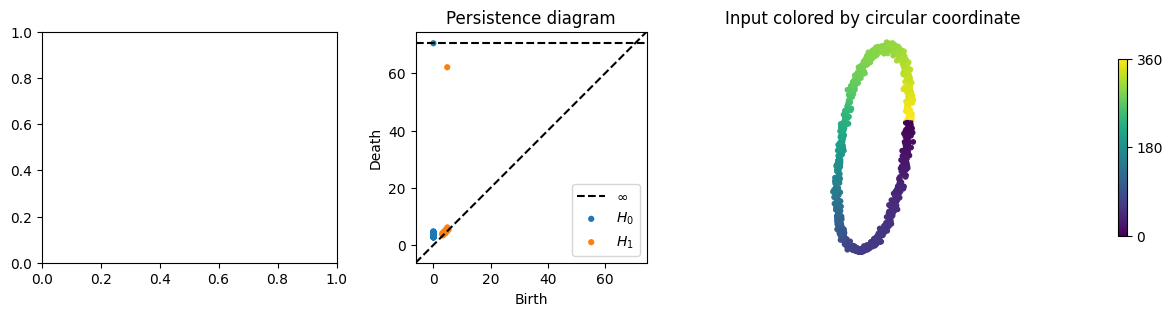
# prepare plot with 4 subplots
f, (a0, a1, a2, a3) = plt.subplots(1, 4, width_ratios=[1, 1, 1, 0.2], figsize=(14, 3))
# plot the persistence diagram, showing a single prominent class
cc = CircularCoords(X, n_landmarks=200)
plot_diagrams(cc._dgms, title="Persistence diagram", ax=a1)
# plot the data colored by the circle-valued map constructed by DREiMac
circular_coordinates = cc.get_coordinates()
a2.scatter(X[:, 0], X[:, 1], c=circular_coordinates, s=10, cmap="viridis")
a2.set_title("Input colored by circular coordinate")
a2.axis("off")
a2.set_aspect("equal")
# plot colorbar
img = a3.imshow([[0, 1]], cmap="viridis")
a3.set_visible(False)
cb = plt.colorbar(mappable=img, ticks=[0, 0.5, 1])
_ = cb.ax.set_yticklabels(["0", "180", "360"])
In [58]:
# plot in 3d
fig = go.Figure()
fig.add_trace(
    go.Scatter3d(
        x=task_points[:, 0],
        y=task_points[:, 1],
        z=noisy_points[:, 2],
        mode="markers",
        marker=dict(size=3),
    )
)
fig.show()
In [59]:
X = noisy_points


def shuffle_entries(data):
    # Shuffle each row's entries independently
    shuffled_data = np.apply_along_axis(np.random.permutation, 1, data)
    return shuffled_data


X_shuffled_1 = shuffle_entries(X)
X_shuffled_2 = shuffle_entries(X)

fig = go.Figure()
fig.add_trace(
    go.Scatter3d(
        x=X_shuffled_1[:, 0],
        y=X_shuffled_1[:, 1],
        z=X_shuffled_1[:, 2],
        mode="markers",
        marker=dict(size=3),
    )
)

fig.add_trace(
    go.Scatter3d(
        x=X_shuffled_2[:, 0],
        y=X_shuffled_2[:, 1],
        z=X_shuffled_2[:, 2],
        mode="markers",
        marker=dict(size=3),
    )
)
In [63]:
rng = np.random.default_rng()

# n_permutations = 10

X_shuff_1 = rng.permutation(X, axis=0)
X_shuff_2 = rng.permutation(X, axis=0)

fig = go.Figure()
fig.add_trace(
    go.Scatter3d(
        x=X_shuff_1[:, 0],
        y=X_shuff_1[:, 1],
        z=X_shuff_1[:, 2],
        mode="markers",
        marker=dict(size=3),
    )
)

fig.add_trace(
    go.Scatter3d(
        x=X_shuff_2[:, 0],
        y=X_shuff_2[:, 1],
        z=X_shuff_2[:, 2],
        mode="markers",
        marker=dict(size=3),
    )
)
In [56]:
from neurometry.datasets.synthetic import hypertorus, synthetic_neural_manifold

num_points = 1000
intrinsic_dim = 2
encoding_dim = 1000

torus_points = hypertorus(intrinsic_dim, num_points)

noisy, manifold = synthetic_neural_manifold(torus_points, encoding_dim, "linear")
WARNING! Poisson spikes not generated: mean must be non-negative
noise level: 7.07%
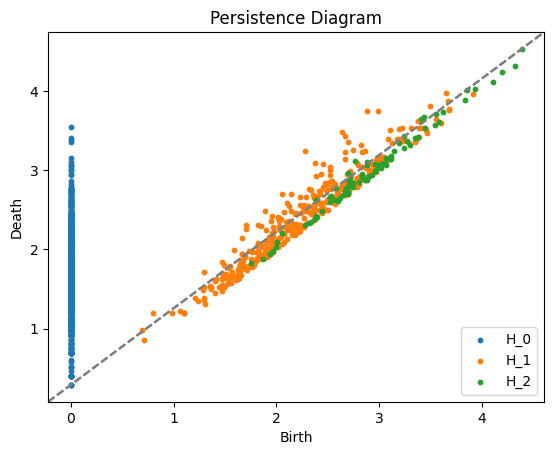
In [57]:
print(manifold.shape)

from neurometry.topology.persistent_homology import compute_persistence_diagrams

diagrams = compute_persistence_diagrams([manifold])

plot_diagram(diagrams[0], homology_dimensions=(0, 1, 2))
torch.Size([1000, 1000])
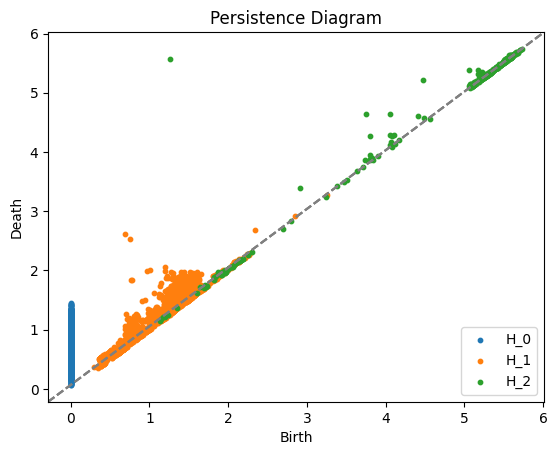
In [58]:
transposed_manifold = manifold.T
print(transposed_manifold.shape)
transposed_diagrams = compute_persistence_diagrams([transposed_manifold])

plot_diagram(transposed_diagrams[0], homology_dimensions=(0, 1, 2))
torch.Size([1000, 1000])
In [48]:
from sklearn.decomposition import PCA

pca = PCA(n_components=10)
pca_manifold = pca.fit_transform(manifold)

pca_diagrams = compute_persistence_diagrams([pca_manifold])

plot_diagram(pca_diagrams[0], homology_dimensions=(0, 1, 2))
In [49]:
pca_transposed_manifold = pca.fit_transform(transposed_manifold)

pca_transposed_diagrams = compute_persistence_diagrams([pca_transposed_manifold])

plot_diagram(pca_transposed_diagrams[0], homology_dimensions=(0, 1, 2))
In [ ]: